

Week In Review – 4/5/2024

Product Updates
DE Life Goes Live With Premium Bonus FIA
We’ve anticipated this over the last few months as we’ve monitored and covered the filings and now it’s official, Delaware Life has launched their most recent product in the IMO channel — PrimeStart Bonus 10.
The AM Best “A-“ rated and Group 1001 company, DE Life had an outstanding 2023 but as we’ll see, over 80% of their annuity sales came from the financial institutions’ space. Only 20% came from the IMO channel. But, if we zoom in on that IMO channel production, 74% was MYGA business. From the chart below, total IMO sales have been relatively steady since 2016 but were recently overshadowed by success in banks and broker/dealers this past year.
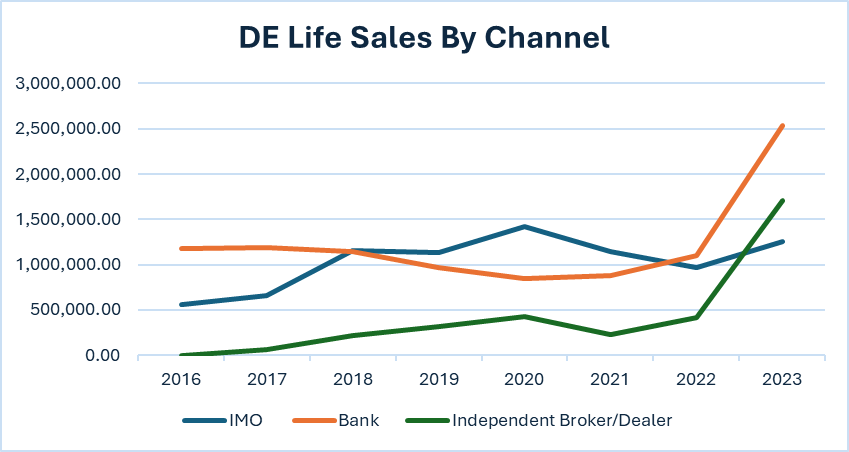
*figures in $000, according to Beacon Research.
It makes logical sense that if DE Life wants to penetrate the IMO channel further, specifically for FIAs, they need a more palatable product. And as sales numbers continue to show, a bonus product like PrimeStart Bonus 10 is where a company like DE Life can make some headway.
PrimeStart Bonus 10 Specs
The ten-year product is flexible premium and includes a 10% premium bonus that’s credited on all premium deposits within the first 60 days, subject to a recapture schedule. We’d classify this bonus as middle-of-the-pack as there’s roughly 12 carriers that currently offer higher bonuses in the IMO channel on 10-year products. There’s a $25K minimum, it issues up to age 80, and 10% free withdrawals begin in Year 1.
Delaware Life was extremely, and some could even argue, overly purposeful in making its interest crediting strategies a differentiator for this product. All indices are banded at $100,000 and they each include a buy-up option for a 1.00% fee. We’ll start with the current rates on the no-fee, high-band S&P 500 strategies.
| S&P 500 | Rate |
| Annual PTP with Cap | 8.00% |
| Annual PTP with Participation Rate | 40.00% |
| Annual PTP with Performance Trigger | 6.00% |
The other available engineered indices are listed below.
Goldman Sachs Canopy Index
First Trust Capital Strength Barclays 10% Index
Franklin SG Select Index
Now for the real differentiators, or features, exclusive to DE Life for interest crediting…
Lowest Starting Index Value – The first feature applies to any initial index allocations and is appropriately named. It uses the lowest index value from the first 90 days of the contract in the calculation of the first annual interest credit. The aim is to prevent a client from buying the local top of any index selection at contract issue. It does not apply to any subsequent one year point-to-point periods.
Each of the engineered indices includes either a Flex-Lock, Volatility Limit and/or Boost and Knockout provision. We’ll define each below.
Flex-Lock – All three engineered indices include the Flex-Lock feature. It’s another name for guaranteed participation rates for the entire surrender term. This could help DE Life in the IMO channel as renewal rates continue to come under scrutiny by IMOs and producers.
Boost and Knockout – These features are only included on the Franklin SG Select Index. A Knockout occurs when the index level falls below the declared knockout rate. For example, if the starting index value is 3,000 and the knockout rate is 97%, if the index ever drops below 2,910 (3,000 * .97) over the one-year point-to-point term, a Knockout is triggered. When a Knockout is triggered, the index return to a client is 0% — no matter how the index performs over the rest of the term. As we’ve written about before, this can make options much cheaper and the participation rates much higher on an engineered index.
The Boost rate is a percentage increase to the index return at the end of the period when a Knockout doesn’t occur. If we use our same example and a Boost rate of 2.00%…if the index grows from 3,000 to 3,150 (5.0%) then the Boost rate is added (5.0% + 2.0% = 7%). The 7% return is multiplied by the applicable participation rate (150%). Ultimately, the total return calculation to a client would be 150% * 7.0% = 10.50%.
Volatility Limit – Included First Trust Capital Strength Barclays index, this feature is a first in the FIA space and we covered it in some detail a few weeks ago when we originally found the filing. In short, the volatility limit performs an automatic lock of the index value once the accrued variance of the index (the total of the daily changes in the index) has exceeded the defined limit, which is currently set at 9.25%. It’s a way to make the options cheaper despite the index itself having a relatively high 10% volatility target, but the tradeoff is a more limited upside. You can see the effect in the rates. Despite the fact that the index has a 10% volatility target, it offers a participation rate that is only 5% off of Goldman Sachs Canopy, which has an 8% volatility target.
You have to hand it to Delaware Life — they’ve certainly differentiated themselves with this latest product offering as they try to capture more IMO channel market share. And, unlike a lot of products that attempt to differentiate with baseline product features or a new index, DE Life is attempting to seperate themselves with the methods used for calculating index credits. On one hand, they’re giving the market what it’s asking for in a premium bonus, and on the other, they’re in contrast with the IMOs and producers who desire a return to simplicity. Nevertheless, it’ll be interesting to watch this tug of war play out and how well PrimeStart Bonus 10 is received in 2024. -Sam Wiss
Athene Raises 10-Year IMO Product Comp
Effective April 1st, Athene is raising street compensation by .50% on the 10-year durations within their IMO suite of fixed-indexed annuities. The following products will see increases:
| Street Comp | NEW Street Comp | |
| Agility 10 | 6.00% | 6.50% |
| Ascent Pro 10 Bonus | 6.50% | 7.00% |
| Performance Elite 10 | 6.50% | 7.00% |
| Performance Elite 10 Plus | 6.50% | 7.00% |
| Performance Elite 15 | 6.50% | 7.00% |
| Performance Elite 15 Plus | 6.50% | 7.00% |
Athene, the IMO channel behemoth, looks like they want to continue riding the momentum of 2023 which was anchored by Performance Elite 10 Plus. Their flagship growth and accumulation play currently offers a hefty 18% premium bonus for a fee of .95%. The fee also allows cumulative withdrawals that stack to 20% if a withdrawal isn’t taken in a prior year and a full return of premium feature after the 4th contract year. Given the great replacement wave we’ve seen in today’s interest rate environment, it comes as no surprise to see Performance Elite 10 Plus with nearly 80% growth year over year.
| 2022 Sales | 2023 Sales | ||
| Agility 10 | 760,898 | 536,628 | -29% |
| Ascent Pro 10 Bonus | 839,779 | 931,784 | 11% |
| Performance Elite 10 | 570,607 | 914,833 | 60% |
| Performance Elite 10 Plus | 1,108,015 | 1,966,750 | 78% |
| Performance Elite 15 | 111,614 | 106,373 | -5% |
| Performance Elite 15 Plus | 505,838 | 451,263 | -11% |
The recent commission increase makes even more sense when you look at Athene’s main competitors in the IMO channel and what they pay their producers. For Allianz, American Equity, North American and F&G, their ten-year products all carry street commissions of 7.0% or greater. And, like most carriers today, each has their own production-based producer incentive that runs the full calendar year. With Athene now only leveling the playing field after already having an edge production-wise on their competitors, 2024 could prove to be another banner year for the Apollo owned annuity carrier. –Sam Wiss
Oceanview Introduces Teaser S&P 500 Cap Rates
In past issues we’ve covered Oceanview and their teaser Fixed rates on their Harbourview FIA suite. Effective April 1st, they’ve taken this strategy a step further. This time, it’s with S&P 500 cap rates on the same Harbourview product. The 7-year cap rate moved to 14.0%, which is top of market. The 10-year cap rate jumped to 15.0% which is also top of market and head and shoulders above the pack — a full 2.75% above the next closest competitor in the ten-year growth space.
What’s interesting is Oceanview’s full transparency around these cap rates being teaser rates and how they will drop on subsequent contract anniversaries. On the product marketing collateral it explicitly states: The cap or participation rate shown for this indexed crediting strategy is for the first contract year only. The rate for subsequent years will be in line with comparable rates, which are likely to be much lower. Rates are going to be reduced on the first contract anniversary, but just how much are they going to be reduced? Oceanview has the difficult task of setting and then maintaining those expectations with producers and clients. The answer, or at least a legitimate proxy, might reside in Oceanview’s illustration software. If a producer runs a Harbourview 10 quote, the S&P 500 cap rate is actually reduced from 15% in the first year to 9% in subsequent years. Again, a nod to transparency from Oceanview here.
In an effort to capture more growth FIA market share, Oceanview isn’t jumping into the premium bonus market like a majority of the major annuity players. Instead, they seem intent on carving out a niche strategy that they believe can add more consumer value by keeping things simple with juicy Fixed rates and S&P 500 caps. We’ll be keeping a close eye on how this strategy plays out for Oceanview and Harbourview 10. -Sam Wiss
Filing Updates
F&G Files Premium Bonus Rider
F&G recently filed a premium bonus rider endorsement. It isn’t entirely clear if the rider is going to be available for one of their current products or something that they’ve filed to keep in their back pocket. We can only speculate, but it’d make complete sense if F&G eventually added a bonus to either 1) Power Accumulator, which is their top-selling product in the IMO channel, or 2) Accumulator Plus, which is their third-best selling product in the IMO channel. Right now, both of those products are built for growth and accumulation but neither have a bonus option available. We’ll continue to keep an eye on any additional filings that come through or if F&G looks to make any changes to their product lineup. -Sam Wiss
Weekly Index Spotlight
Goldman Sachs Canopy Index
Launched – 3/7/2024
Availability – Delaware Life
Constituents – Core Portfolio, Satellite Portfolio, Cash (+/-)
Specs – 8% Volatility Target, Excess Return
Decrements – 0.5% Embedded Cost, Rebalancing and Servicing (2.42% on average)
One of the trends in engineered indices over the past year has been a focus on simpler structures that are easier to understand and explain. But for every trend, there’s a countertrend – and Goldman Sachs Canopy is a prime example of the countertrend. The index is comprised of three pieces. The first is a Base portfolio comprised of US Equities, US TIPS, Gold, US Nominal Bonds (traditional fixed income) and Broad Commodities. It’s a typical multi-asset structure except that the allocation shifts twice a month between four settings depending on what “regime” the index has determined is the current state of the macroeconomic environment. Here’s what it looks like in practice:

Theoretically, this regime-based structure is actually simpler than a typical multi-asset index that changes regularly and seemingly without explanation because the allocation for each regime is locked in and the regime only changes twice a month. However, Canopy has another element at play – the Satellite index, which contains three alternative strategies that are theoretically uncorrelated to the overall market. The Satellite index is not regime-based and is much more dynamic. The proportion between the Base and Satellite index is risk-based. The Base makes up 2/3 of the risk, the Satellite makes up the remainder. And since that risk metric is done daily, the allocation between the two portfolios also shifts daily.
Layered on top is an 8% volatility target that is managed through daily cash allocations and an Excess Return deduction. The index also has a standard 0.5% embedded cost. But because of the complexity of the Satellite portfolio and the need for continuous rebalancing, the index deducts the costs of rebalancing and servicing. That sounds like a trivial line-item but it’s not. The total cost for rebalancing has averaged a whopping 2.42% and has been as high as 3.29%. This is a very, very active index – despite the fact that the Base portfolio is actually pretty tame.
So how has it performed? That’s where the story gets even more interesting. There is naturally quite a bit of hindsight bias in index creation. We’ve joked in past articles that nothing solves yesterday’s problem better than today’s index. In the context of Canopy, it’s not hard to spot the particular problem that the index is trying to solve. Take a look at the backtested performance of Canopy relative to a standard S&P 500 Daily Risk Control 7.5% Excess Return index:

Whereas the S&P 500 DRC index was essentially flat for 2020 (thanks to a huge drawdown in March), Goldman Sachs Canopy rips to an astronomical 27.4% return, higher than the S&P 500 itself that year and by far the highest return in the backtested period all the way back to 2004. How did that happen? Who knows. If we start the clock for the comparison after 2020, the advantage switches. Take a look:
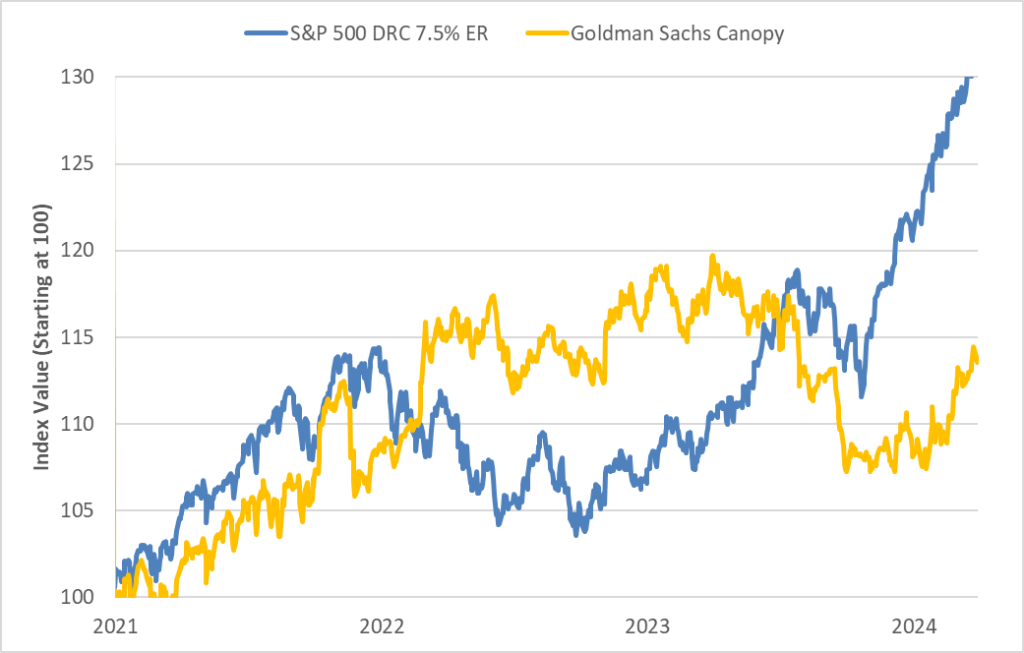
But even under this comparison, it’s hard to argue that Canopy doesn’t deliver on one of its core value propositions – non-correlation to US equities. The only categorical argument in favor of using engineered indices is that they offer diversification benefits. A lot of engineered indices don’t actually deliver on those benefits because their composition doesn’t allow it. All of the moving pieces in Canopy seem to come together to build an index that delivers on diversification, but at the cost of being understandable and explainable. Whether that’s a worthy tradeoff is up for agents and their clients to decide. -Bobby Samuelson
Benchmarks
YTD Engineered Index Performance
| Average Index Return | 1.71% |
| Best Performing Index | 5.37% |
| Worst Performing Index | -1.05% |
| Positive Index Count | 20/25 |
We use a sample of 25 Excess Return engineered indices with volatility targets between 4% and 6% available on Bloomberg. Tickers are SGIXBGNL, CSTREND5, BXIITBZ5, LSMANFI, BNPMAD5, CITIFB5N, CSEATEDG, GSVOYGR, SGIXBUNL, GSGRNDPX, CITIMSTR, SPXT5UE, BTSIDB2E, FIDMFYDN, GSNHRZON, JPUSMERC, AIPEX, AQRDAI5, ZEDGENY, JMOZAIC2, BOFADST5, CIBQB05E, EEJPUS5E, BXFTCS5E and CIBQWS6E.
Fair-Market S&P 500 Caps and Participation Rates
| Option Budget | S&P 500 Cap Rate | S&P Par Rate | |
| 4/2/2024 | 4.87% | 9.55% | 59.47% |
| 3/26/2024 | 4.77% | 9.42% | 59.18% |
| 3/19/2024 | 4.83% | 9.30% | 58.74% |
| 3/12/2024 | 4.69% | 9.06% | 57.86% |
| 3/5/2024 | 4.79% | 9.18% | 58.89% |
| 2/27/2024 | 5.07% | 9.06% | 59.55% |
YTD Index Returns as of 4/3:
- S&P 500: 9.88%
- Nasdaq: 10.24%
- Dow Jones: 3.74%
Treasury Yields (week over week change, as of 4/3)
- 1-year: 5.03% (+4 bps)
- 2-year: 4.68% (+14 bps)
- 3-year: 4.48% (+12 bps)
- 5-year: 4.34% (+16 bps)
- 10-year: 4.36% (+16 bps)
- 20-year: 4.61% (+7 bps)
- 30-year: 4.51% (+15 bps)
The S&P 500 saw a record closing high again last week and is having the best start to a year since 2019. The benchmark index was up over 3% in March and nearly 11% in the first quarter. The anchor has been artificial intelligence stock Nvidia, which is up 83% in Q1 alone and has a $2.25 trillion-dollar market cap (behind only Microsoft and Apple). Investors are looking forward to Friday’s monthly jobs report which should give the Fed more information on the overall state of the economy. Rate cuts are still priced in for the back half of 2024. Oddsmakers (CME FedWatch Tool) are predicting a 97% chance that rates are left unchanged at the May meeting, and 61% chance that the first rate cut happens at the June 12th meeting — two additional cuts are expected to follow the first. -Sam Wiss